

You have probably seen scenes like these: subway entrances with steps that look like clogged pools, water gushing upward in waves; roads under overpasses that normally carry a steady flow of traffic gradually filling with water as a rainstorm begins, only to be closed entirely within minutes; underground parking garages that make your stomach drop, because once water gets in, the losses start snowballing.
What is even more worth reflecting on is that during the same rainstorm, different parts of a single city can face completely different situations. Two streets apart can feel like two different weather systems: on one side, your shoes barely get wet; on the other, water is already knee-deep. One residential compound is still walkable while the one next door is pumping water in an emergency rescue. You cannot explain this disparity with a single rainfall figure. What truly determines the consequences of urban flooding is not rainfall alone, but the combined effect of the precipitation process, the city’s drainage capacity, and its water catchment pathways. Rainfall is just the surface. The hidden forces that determine outcomes are the city’s terrain depressions, the degree of surface hardening, and drainage capacity.
This raises a sharper question:Is there a way to tell us, before the rainstorm arrives, where this storm is most likely to concentrate its pressure and how much damage it will cause? In other words, can we move from post-event analysis to pre-event prediction, so that emergency preparedness, facility management, and insurance risk management are no longer driven by experience alone, but by more reliable computational evidence?
What YoujiVest is doing is precisely this: turning pre-event prediction into results that are computable, explainable, and actionable.
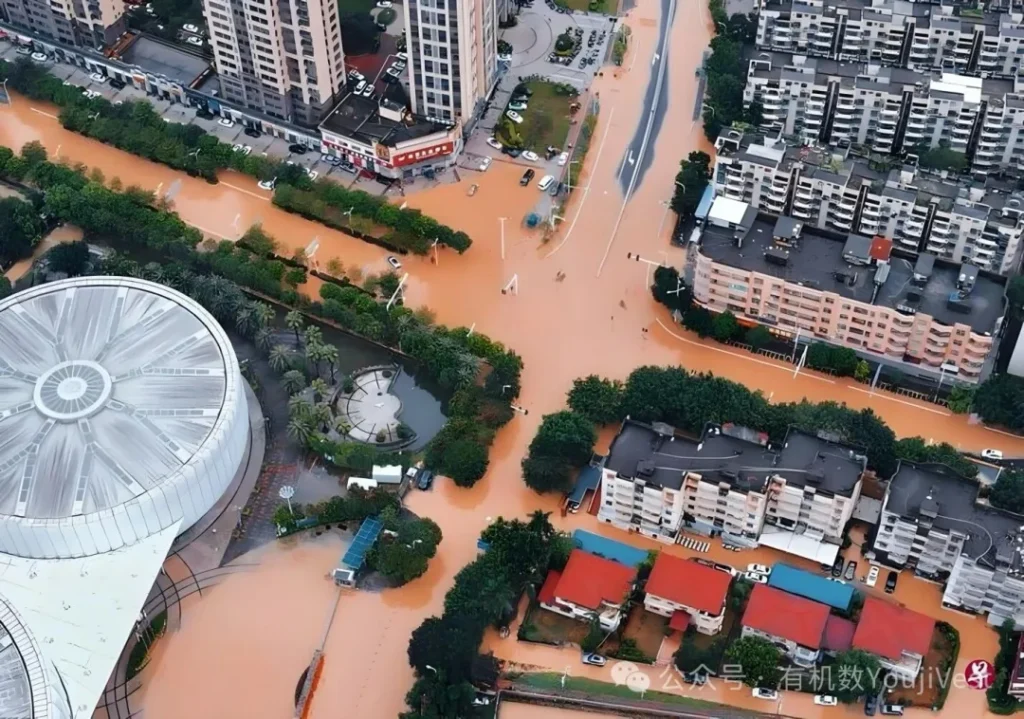
Image source: Baidu News, “Multiple areas in Fujian hit by Typhoon Haikui, severe urban flooding disrupts city transportation”
Why the Same Storm Produces Different Losses?
Many people equate urban flooding with “poor drainage,” but drainage is only half the story. The real difficulty with urban flooding is that it is a highly localized hazard:risk points are dispersed, conditions change rapidly, and it is nearly impossible to summarize in a single sentence.
The same amount of rainfall, falling on different urban “foundations,” produces entirely different outcomes. The more hardened the surface, the less water can infiltrate; the lower the terrain, the more water tends to pool and stand; the more strained the drainage capacity, the faster water accumulates in a short period. In many cases, what truly determines losses is not widespread standing water but a handful of critical points: subway entrances, underpasses, low-lying sections of overpasses, entrances to underground commercial spaces, and low-lying corners near facility equipment rooms in industrial parks. Once these points are hit, losses are amplified.
What makes this even more challenging is that the city is changing, and so is the rain. Urban expansion, increasing impervious surface area, and rising asset values mean that the same amount of standing water causes higher losses; extreme short-duration heavy rainfall events are becoming more frequent, making drainage systems more prone to being overwhelmed. Relying solely on historical claims data for experience-based extrapolation is therefore increasingly prone to error.Not because history is useless, but because the variables shaping the future far outnumber those of the past.
From Binary Risk to Quantified Loss
Urban flooding risk comes in two versions in the real world.
One is the “news version”: where is the standing water, where is traffic paralyzed. It gives you a feeling.
The other is the “decision version”: if this storm hits, where is most at risk, roughly how large are the losses, and how bad could it get in a worst case. It gives you a basis for action.
YoujiVest’s new urban flooding capability targets the second version: turning risk into usable information before the rainstorm arrives. It can be summed up in one sentence:computing in advance whether this storm will cause flooding, where it will flood, and how much damage it will cause.
How the Model Works
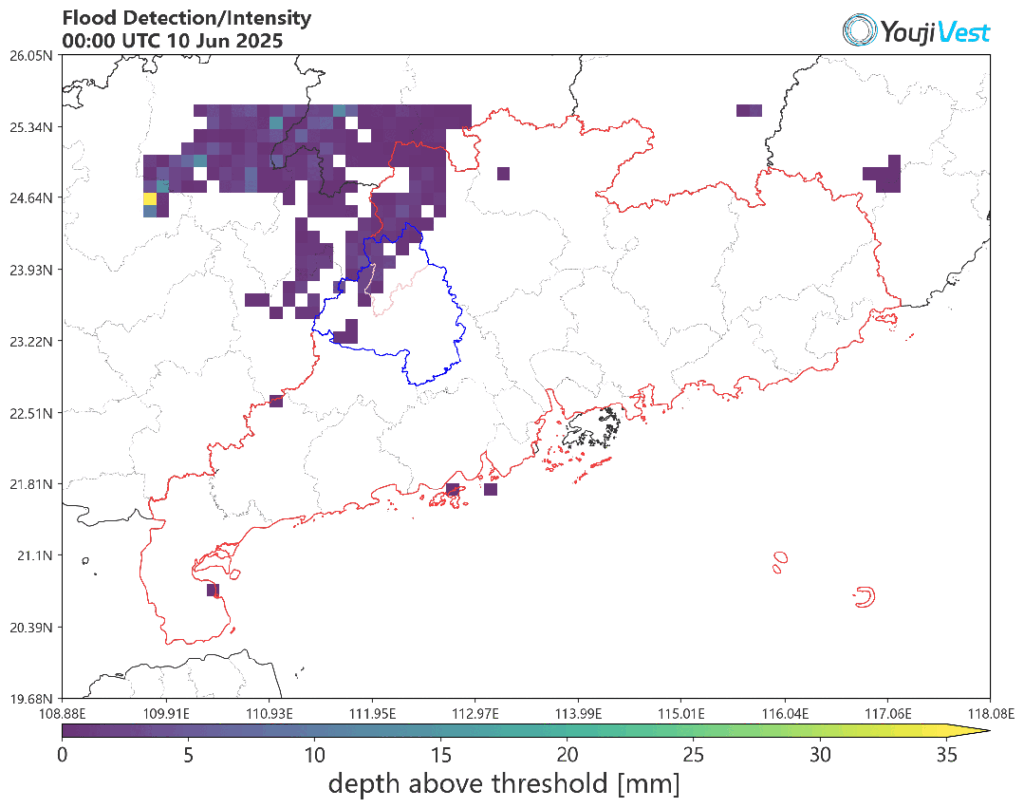
Image source: YoujiVest Climate Risk Lab
Our logic is straightforward: first, we compile the rainfall processes that could cause urban flooding into a rainfall event library; then we convert each rainfall event into a city-scale inundation depth map; finally, we spatially align water depth with asset distribution and, combining each asset type’s vulnerability to water, translate depth into loss.
You can remember it in one sentence: rain comes in, where does the water go, what gets flooded, and how much is the final loss. We computed each link in that chain.
This is not about producing a “pretty map.” It is about answering a more practical question: when a rainstorm becomes a set of possible scenarios, which scenarios are most dangerous, and how dangerous are they?
Three Actionable Outputs
A truly valuable risk product cannot stop at three words: “there is risk.” It must enable you to act.
The first output is “knowing in advance where problems will occur.”The most critical aspect of urban flooding is not water everywhere, but that a small number of risk points determine the majority of losses. Our output flags the locations most likely to experience problems in advance: where standing water is most likely, how deep it will be, and how far it will spread. For industrial parks, property managers, and emergency teams, this means pumping equipment, sandbags, warning cordons, and personnel can be deployed to the right locations in advance, rather than chasing the water after it has already arrived.
The second output is “quantifying losses to an order of magnitude.” What many decision-makers actually need is not a string of technical jargon, but a range that can support decisions: under the most likely scenario for this rainstorm, what order of magnitude do losses fall in; under a more extreme scenario, how bad could it get. For enterprises, this supports more realistic contingency plans; for government agencies, it supports more targeted coordination and resource allocation; for insurers, it supports assessment of whether underwriting structures are appropriate.
The third output is “turning low-probability, high-severity losses into a curve.” This sounds technical, but the meaning is very intuitive. We output Average Annual Loss (AAL), which you can think of as “the average annual cost of risk you need to bear.” We also output Exceedance Probability curves (EP curves), which answer the question “what is the likelihood of a loss of a given size occurring.” For pricing, capital allocation, or reinsurance layering, AAL and EP curves are the common ruler that makes risk comparable, manageable, and structurable.
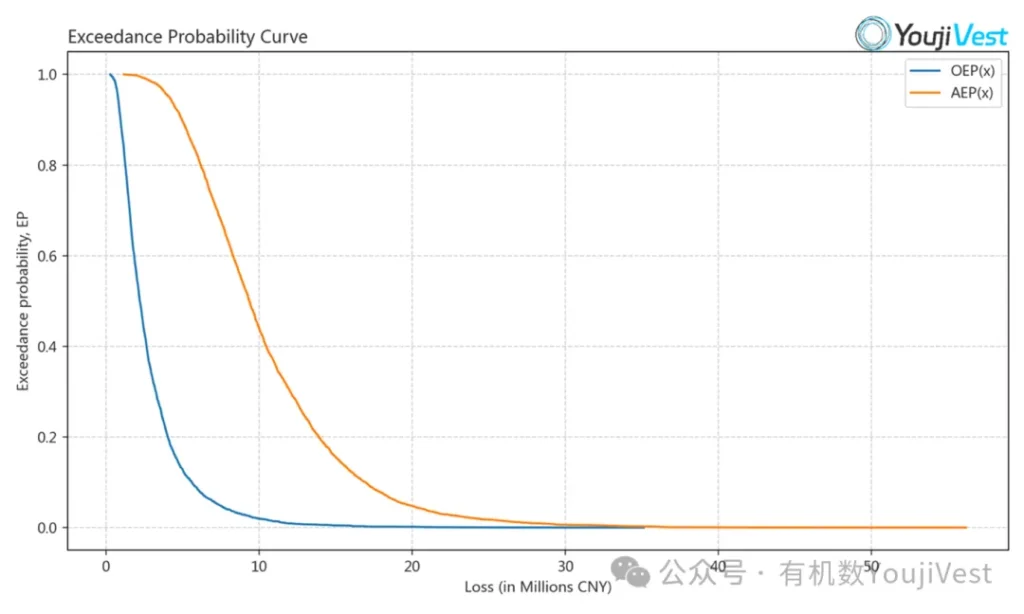
Image source: YoujiVest Climate Risk Lab
Transparent by Design
Risk assessment is most vulnerable to two things: being highly complex but unable to be explained clearly; and delivering results that cannot be traced back to their causes.
When designing this capability, we deliberately did one thing: make every output traceable. You can see which rainfall scenario a given loss estimate corresponds to, how water depth formed under terrain and drainage constraints, how assets were affected, and how losses were derived from water depth. More importantly, we perform layered validation at key stages: whether rainfall scenario selection is reasonable, whether water depth distribution aligns with historical ponding patterns, whether loss curves are consistent with engineering common sense and industry experience, and where shifts in key parameters would push the results. Results that can be explained earn trust in business applications; results that can be traced back support decision-making.
What We Are Working On
Focused on “how precipitation drives urban flooding,” we are currently prioritizing two areas of work.
The first is understanding the “rhythm” of rainfall at a finer resolution. The same total rainfall, with different peak intensities, durations, and coverage areas, can produce entirely different ponding outcomes.We are incorporating these differences more effectively into scenario construction and assessment, enabling the model to better distinguish “same rainfall, different consequences.”
The second is articulating spatial explanations more clearly. Urban flooding is never caused by a single factor; it is the combined result of the precipitation process, drainage conditions, and water catchment pathways.We are continuously strengthening how we present the relationships among these three factors, so that risk points are not only “computable” but also “explainable,” facilitating engineering communication and management implementation.
Storms Are Uncontrollable. Losses Don’t Have to Be.
Urban flooding is not inevitable. When a rainstorm can be converted into a water depth map, and a water depth map into loss and risk metrics, the response shifts from post-disaster recovery to pre-event decision-making: where to reinforce, how to price, and how to structure reinsurance and capital.
The key to understanding urban flooding has never been how much rain fell. It’s where the storm concentrates its pressure.
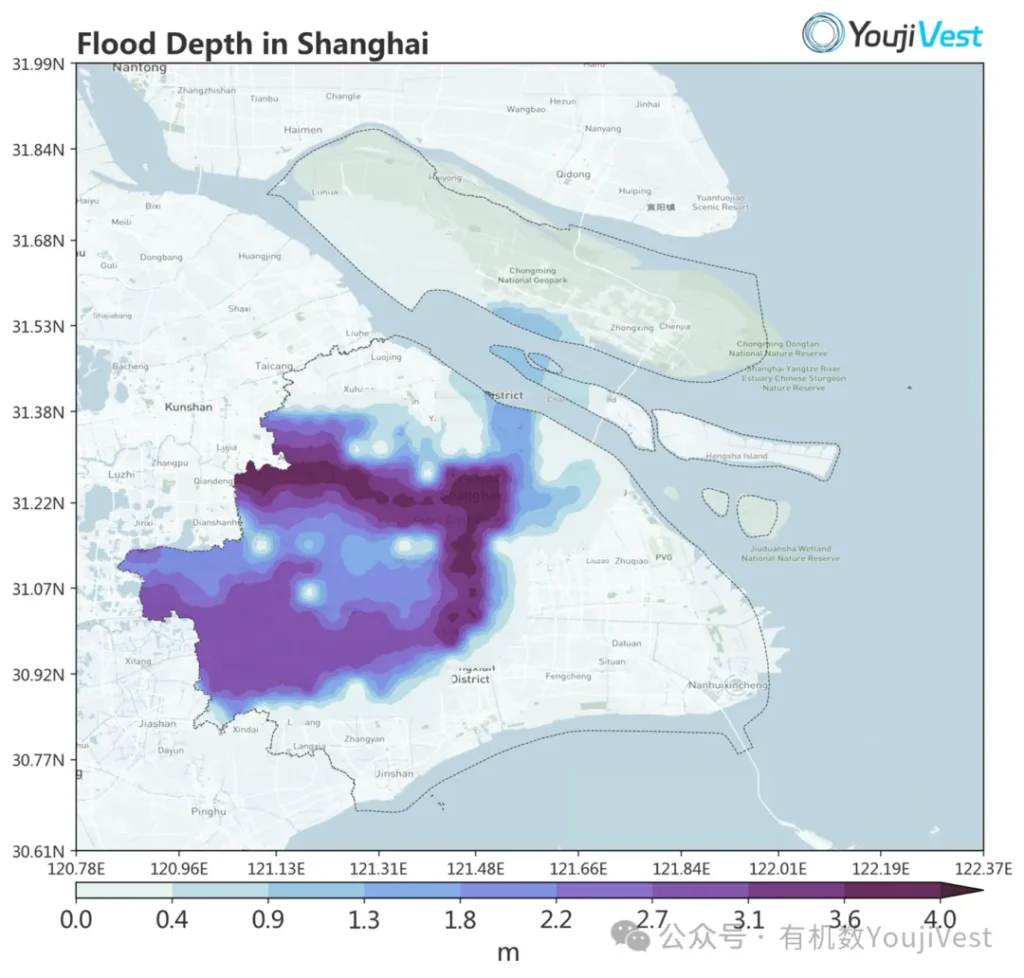
Image source: YoujiVest Climate Risk Lab